Home Energy Monitor
16 April 2023
This year, I embarked on an exciting journey of harnessing solar power for my home. My starting point was a 400Wp solar panel that I installed on my balcony. The inverter for this is a Deye Sun 300, which houses a built-in webserver. This server continuously provides data about the amount of energy currently being generated.
After successfully integrating the inverter with my home network, I was able to parse the data on my home server, producing compelling visualizations of my solar energy production. This process was relatively straightforward, and the output is viewable on the Loxone app.
However, my quest for energy independence did not stop at solar power generation; I also wanted to understand our home’s power consumption, particularly our draw from the energy grid.
Setting Up the Electricity Meter
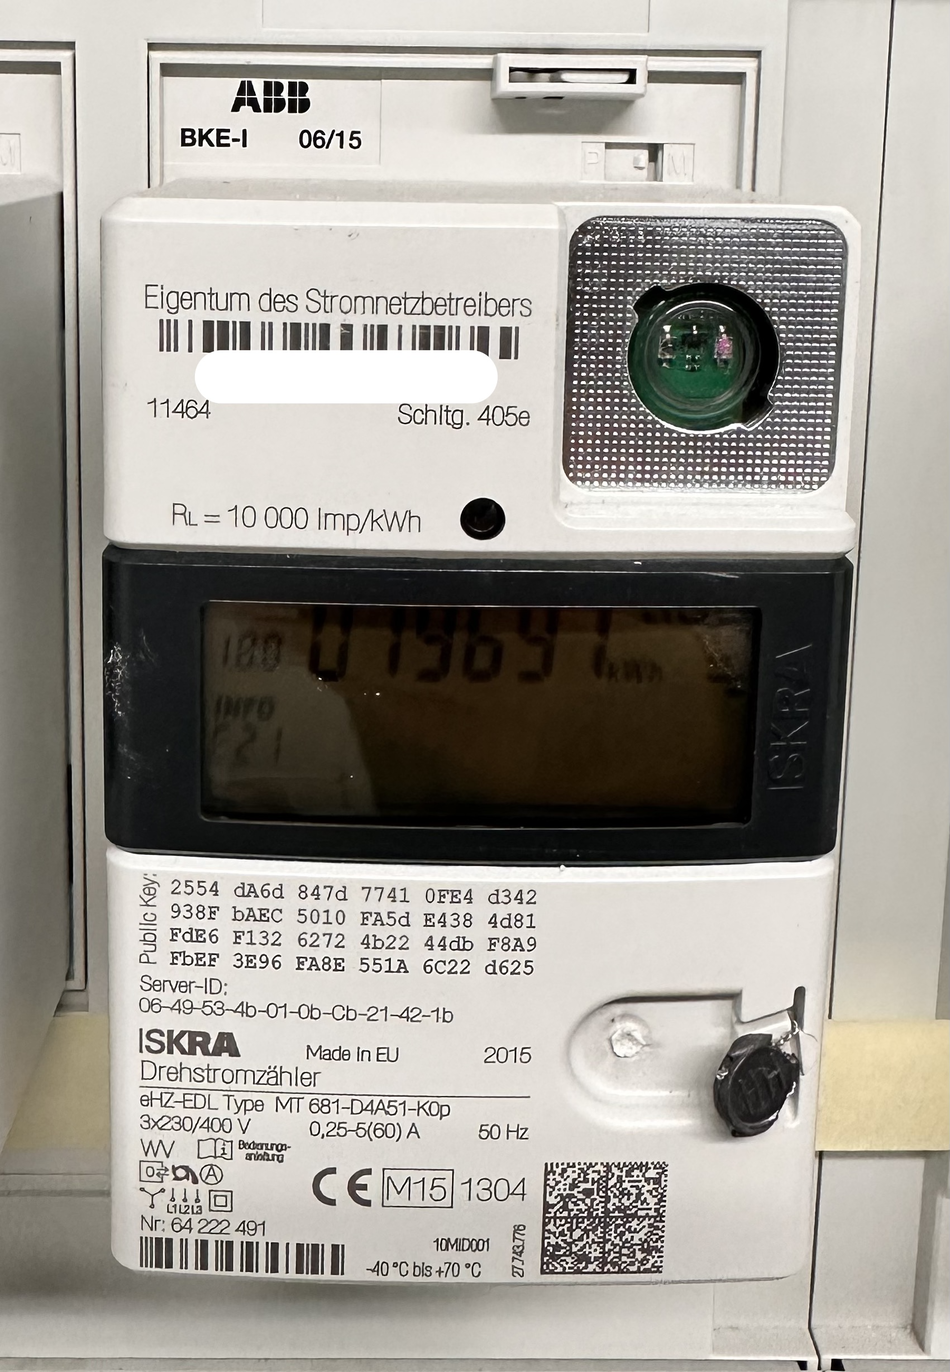
My apartment complex is equipped with smart electricity meters, specifically the ISKRA MT-681. This meter is capable of reporting the current power usage every half-second via an optical serial output.
To access this feature, however, the meter had to be unlocked using a pin, which I obtained from the company that manages our electrical grid. Surprisingly, they were quite responsive and sent me the pin and a comprehensive PDF guide within a few minutes of my request.
Unlocking the electricity meter was as simple as flashing the optical sensor with a flashlight and inputting the pin by flashing the sensor a specified number of times, as detailed in the PDF guide.
Hardware for Reading the Output
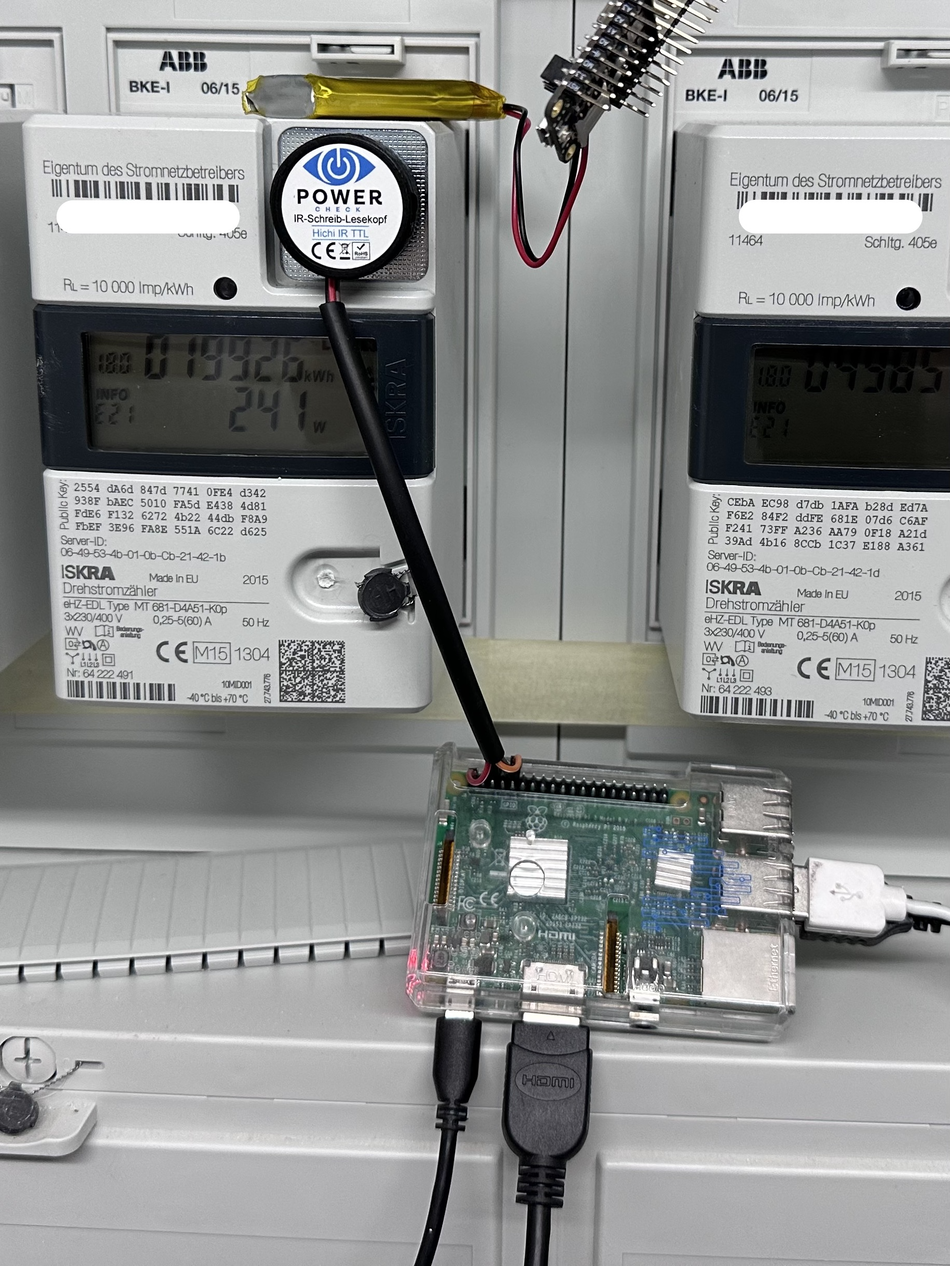
To read the meter’s output, I purchased an adapter that attaches to the electricity meter with a magnet. Initially, I connected this adapter to a RaspberryPi to test whether it could generate meaningful output. This particular adapter is a Hichi IR TTL, which I bought from an eBay user.
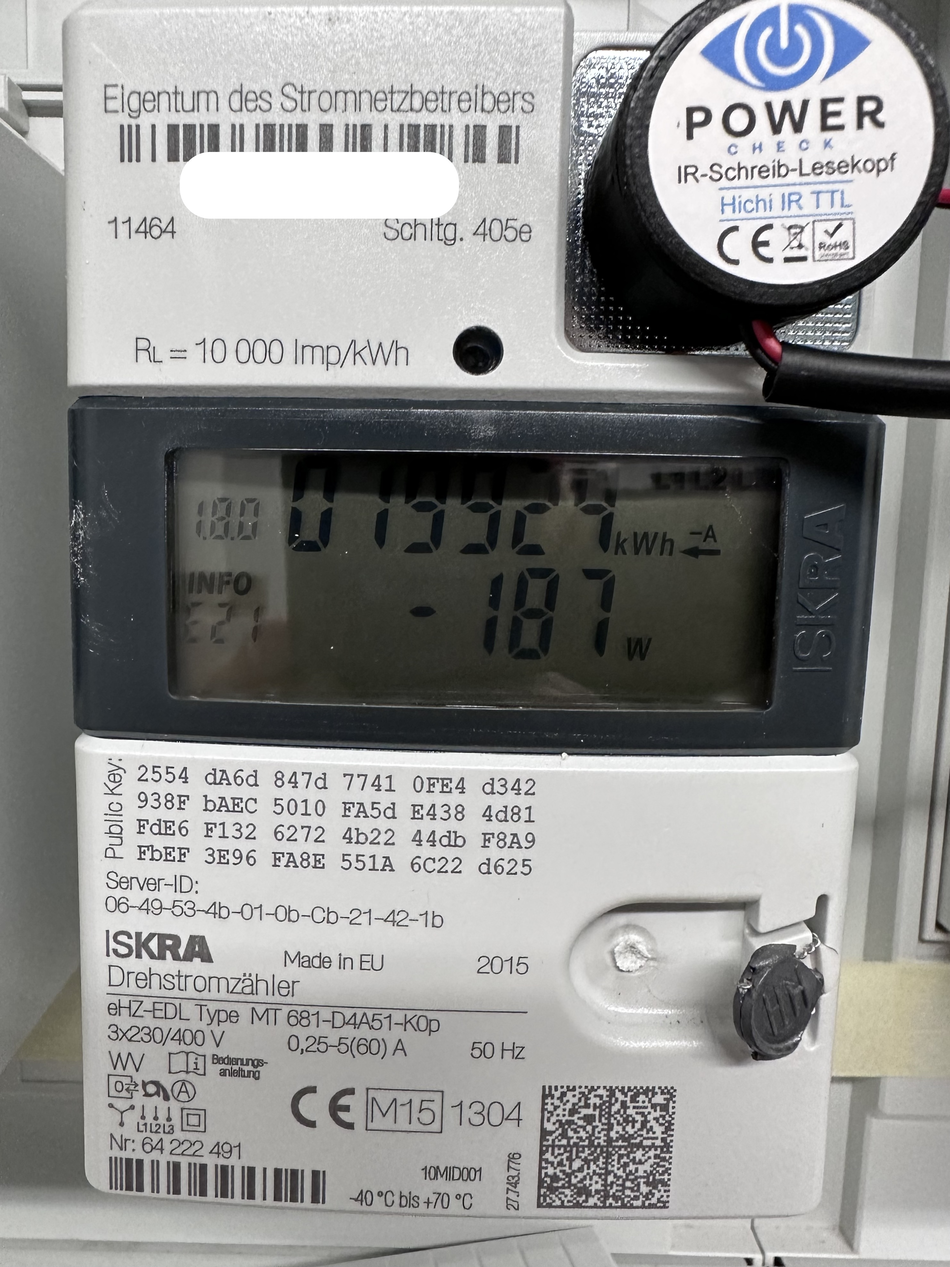
Interestingly, the meter revealed that our apartment was occasionally generating more energy than it was consuming, resulting in us feeding power back into the grid (indicated by the negative power consumption in the picture above). The sun must have been shining when the above picture was taken, and not much power was being used at the time.
The adapter communicates with the RaspberryPi using a serial connection running at 9600 baud (8 bits, no parity). To enable the RaspberryPi to listen to this output, I followed a tutorial on YouTube that explains how to make the RaspberryPi use the Tx and Rx pins for input rather than outputting a serial console on those pins (which is the default).
The appropriate command string for minicom, a text-based modem control and terminal emulator program, is as follows:
sudo minicom -D /dev/ttyS0 -b 9600 --displayhex --wrapAnd here you can see a video of the output:
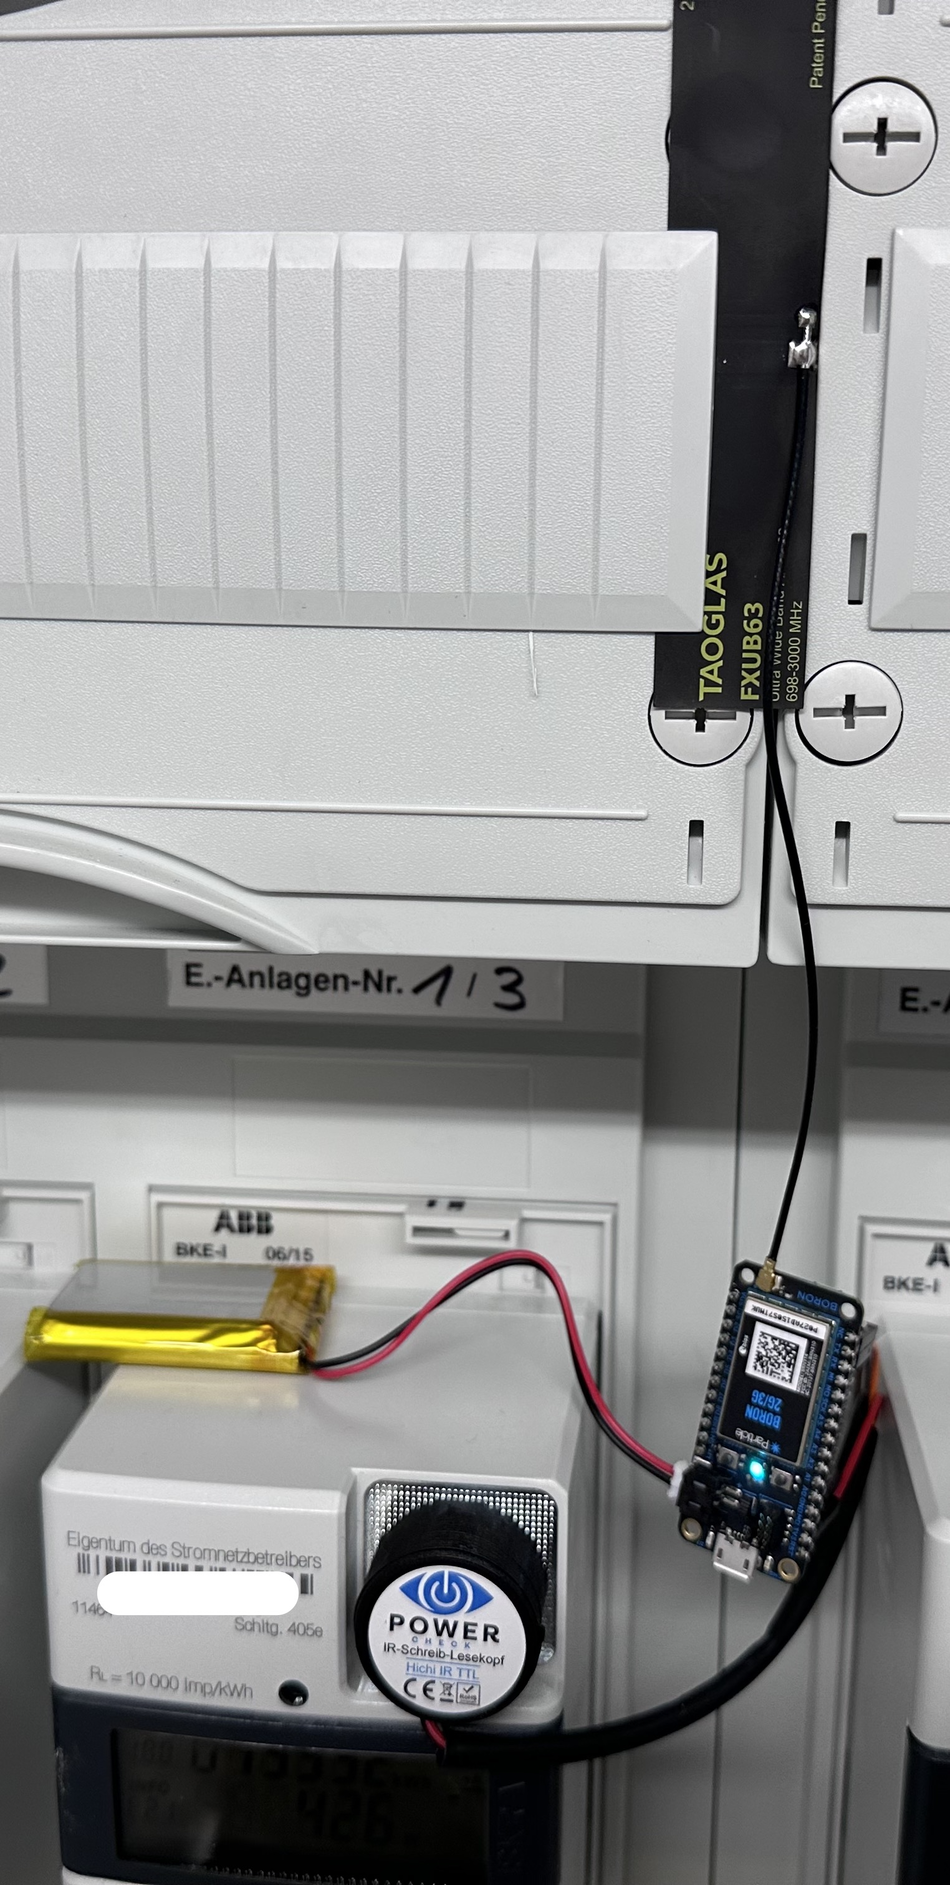
And here is a closeup of the whole setup with the RaspberryPi attached to it.
Software for Reading the Output
The data being transmitted from the meter uses the “SML” protocol (you can find lots of information about the protocol here), which supports a wide variety of data. However, I was only interested in a small subset of this data. The SML protocol marks the beginning and end of its data stream with specific byte sequences:
// start sequence of SML protocol
 const byte startSequence[] = { 0x1B, 0x1B, 0x1B, 0x1B, 0x01, 0x01, 0x01, 0x01 };
// end sequence of SML protocol
const byte stopSequence[]  = { 0x1B, 0x1B, 0x1B, 0x1B, 0x1A };
The power sequence, which was my primary interest, is encoded in 4 bytes and is also preceded by a start sequence:
// sequence preceeding the current "Wirkleistung" value (4 Bytes)
const byte powerSequence[] = { 0x07, 0x01, 0x00, 0x10, 0x07, 0x00, 0xFF, 0x01, 0x01, 0x62, 0x1B, 0x52, 0x00, 0x55 };
The task of the software is to read the serial input, identify the start and stop sequences of the SML protocol, and then find the power sequence within that data. Once identified, the software slices the subsequent four bytes, which represent the current power usage. This valuable information is then sent to the smart home server… somehow.
Where to Send the Data?
Ideally, the smart home server would be placed adjacent to the electricity meter for easy data transmission. However, in my case, connectivity between the basement (where the electricity meter is located) and the apartment was quite limited.
After exploring various options, I decided to leverage the mobile network and a cloud solution to transmit data to the smart home server. I chose the Boron 2 from Particle, which conveniently comes with an onboard SIM card. Particle also provides a user-friendly cloud API that allows for easy data uploading:
Particle.publish("currentpower", String(currentpower));Once the RaspberryPi was replaced with the Boron, the setup looked like this:
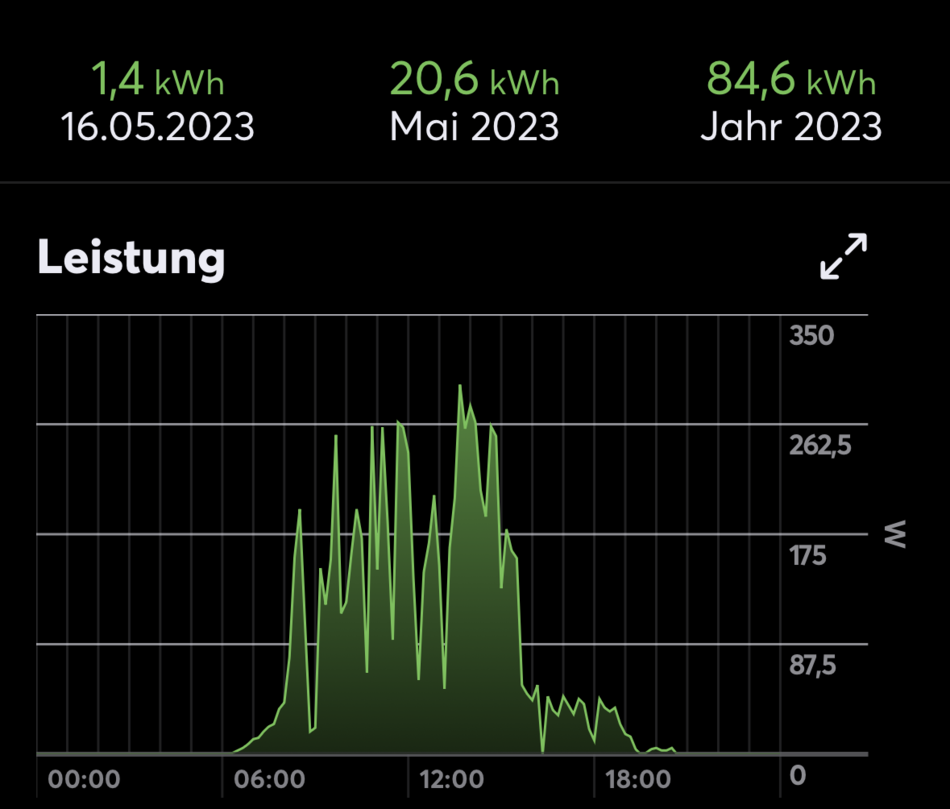
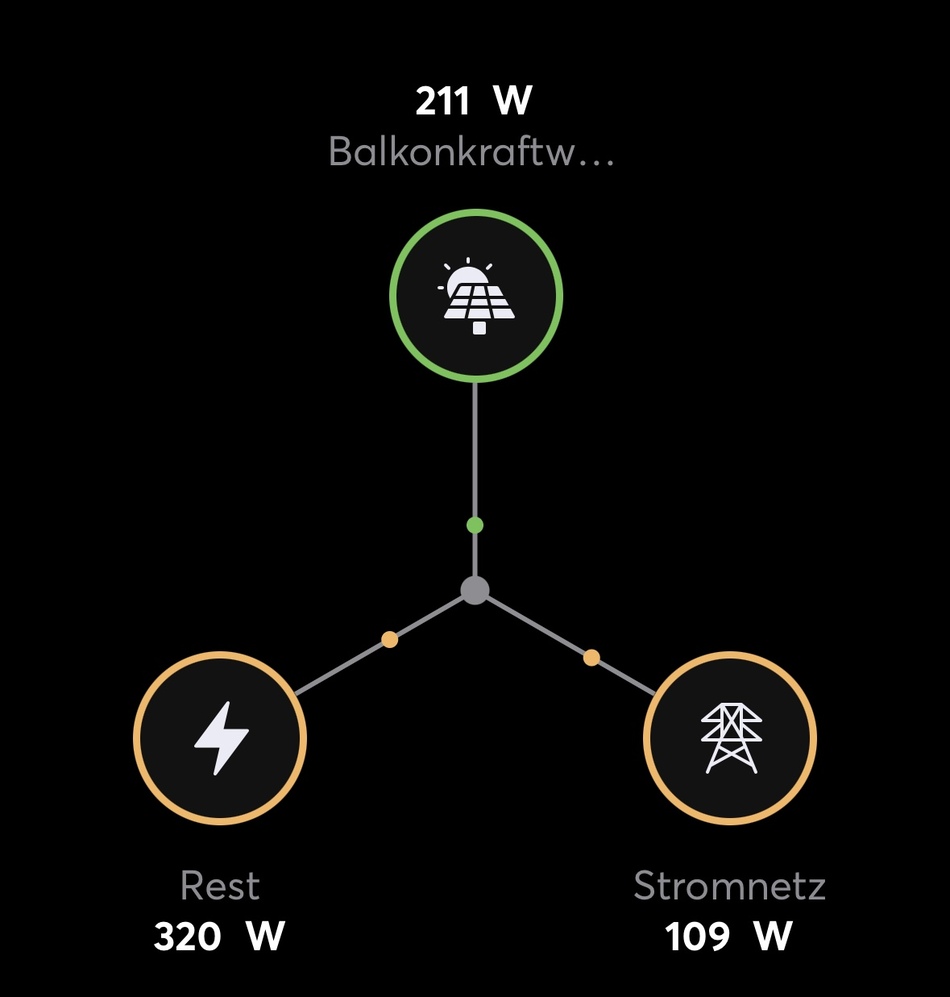
Having the data in the cloud, fetching it from there and integrating it with the smart home server enabled me to generate comprehensive visualizations of our apartment’s total energy consumption. This data provides a clear picture of where our energy is coming from and how much we consume in total:
Limitations and Workarounds
One downside of the Particle cloud is that it caps free data operations at 100,000 per month. Given that the electricity meter generates data every half-second, this limit could be quickly exhausted. To avoid incurring additional costs, I implemented a throttling mechanism that limits data operations to around 3,000 per day. This mechanism sends data less frequently during the night (only every 5 minutes) and more frequently during the day (every 20 seconds).
Code
You can find the complete code for this project on Github. This home energy monitor project is an excellent example of how you can combine simple hardware, a little bit of programming, and readily available technologies to gain a comprehensive understanding of your home’s energy consumption and generation.